
Graph view
On this page
Graph view
Your whole project as one interactive map — every entity, every connection, and every gap in the spec. · Optional
The Graph view draws your entire spec as a single force-directed network: personas, features, stories, criteria, pages, and schema tables, all wired together by their real relationships. It's a visualisation, not a step you have to complete — but it's the fastest way to see how connected (and how complete) your project is.
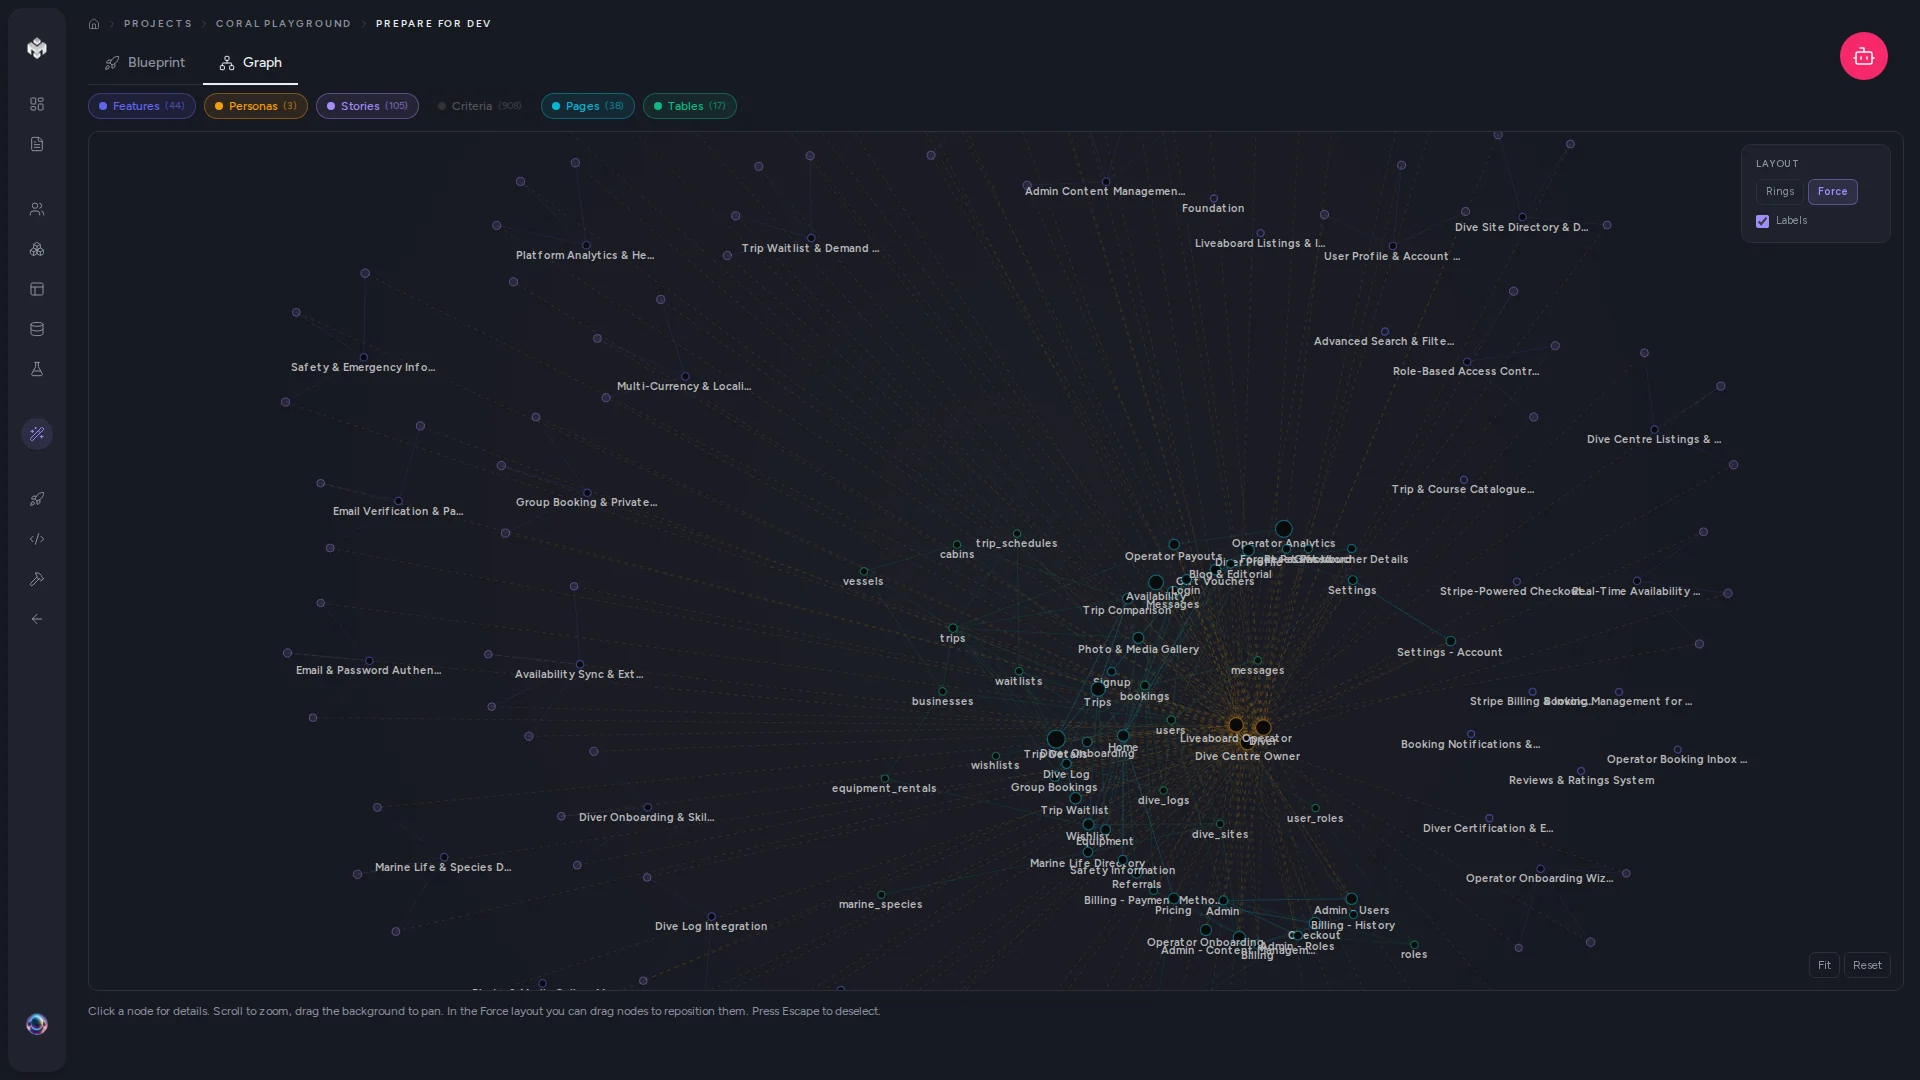 Figure: The Graph tab on the Prepare for Dev page, with the entity-type filters across the top.
Opening the graph
Open a project and select the Graph tab on the Prepare for Dev page (its two tabs are Blueprint and Graph; the PRD and Dev Spec are documents in the Docs hub now). The graph builds itself from whatever you've generated so far — if the project is empty you'll see "No entities to visualize yet. Generate personas, features, or pages first."
Reading the map
Nodes are laid out Obsidian-style — flat coloured dots that cluster by relationship rather than sitting in a rigid tree:
- Colour encodes type. Personas (amber), features (indigo), user stories (violet), acceptance criteria (red), pages (cyan), schema tables (emerald), and page sections and nav components in their own hues.
- Size encodes connection count. Node radius sits in a deliberately narrow band, so only genuine hubs — a feature tied to many stories, a page many sections depend on — read as slightly larger. The eye groups by colour, not by size.
- Lines are relationships. Feature → story, story → criterion, persona → story, criterion → page, page → table, and so on.
By default the graph shows personas, features, stories, pages, and schema tables. Use the filter chips at the top to toggle any type on or off — including acceptance criteria, sections, and nav components — each with a live count.
Level of detail
Labels fade in as you zoom so a large graph stays readable: zoomed out, you see the shape with no text; at medium zoom, only hub labels (features, personas, pages, schema tables, sections); zoomed in, every label. Just zoom in on the cluster you care about.
Spec-gap outlines
This is the graph's most useful trick. Incomplete entities are drawn as a hollow outline instead of a filled dot, so gaps jump out at a glance. A node is flagged as a gap when it's:
- Isolated — an entity with no relationships at all.
- An orphan user story — a story with no parent feature linking into it.
- An uncovered criterion — an acceptance criterion never mapped to a page.
💡 Tip: Scan for hollow dots before you head to handoff. Each one is a loose thread — an orphan story to reconnect, or a criterion that never made it onto a page (run Derive Criteria from Pages to close those).
Interacting
- Hover a node for a tooltip and to highlight its immediate neighbours.
- Click a node to open the detail panel, focus the camera on it, and dim everything but its connections.
- Drag a node to reposition it; scroll to zoom; drag the background to pan.
- Fit and Reset buttons (bottom-right) reframe the whole graph, and Escape deselects.
⚡ Power-user hints
- Filter down to two types to audit one link. Show only personas and user stories to see at a glance which personas are underserved, or pages and schema tables to check every screen has its data.
- Hubs are your architecture. The biggest, most-connected nodes are the load-bearing parts of the product — worth extra review before build.
- It's read-only. The graph reflects your spec; to fix a gap, edit the underlying entity in its own tab, then come back and watch the outline fill in.
↔ The traditional way
Keeping a mental model of how a PRD, a backlog, a sitemap, and an ERD all connect is a job normally done in someone's head — and the gaps only surface mid-build when a story turns out to have no screen. The Graph view makes the whole dependency structure literal and marks the holes for you, so you find the loose threads while they're still cheap to fix.
What's next
- Close any gaps in coverage → Acceptance criteria
- Design the data model the graph references → Generating the database schema
- All the project visualisations in one place → Visualisations index