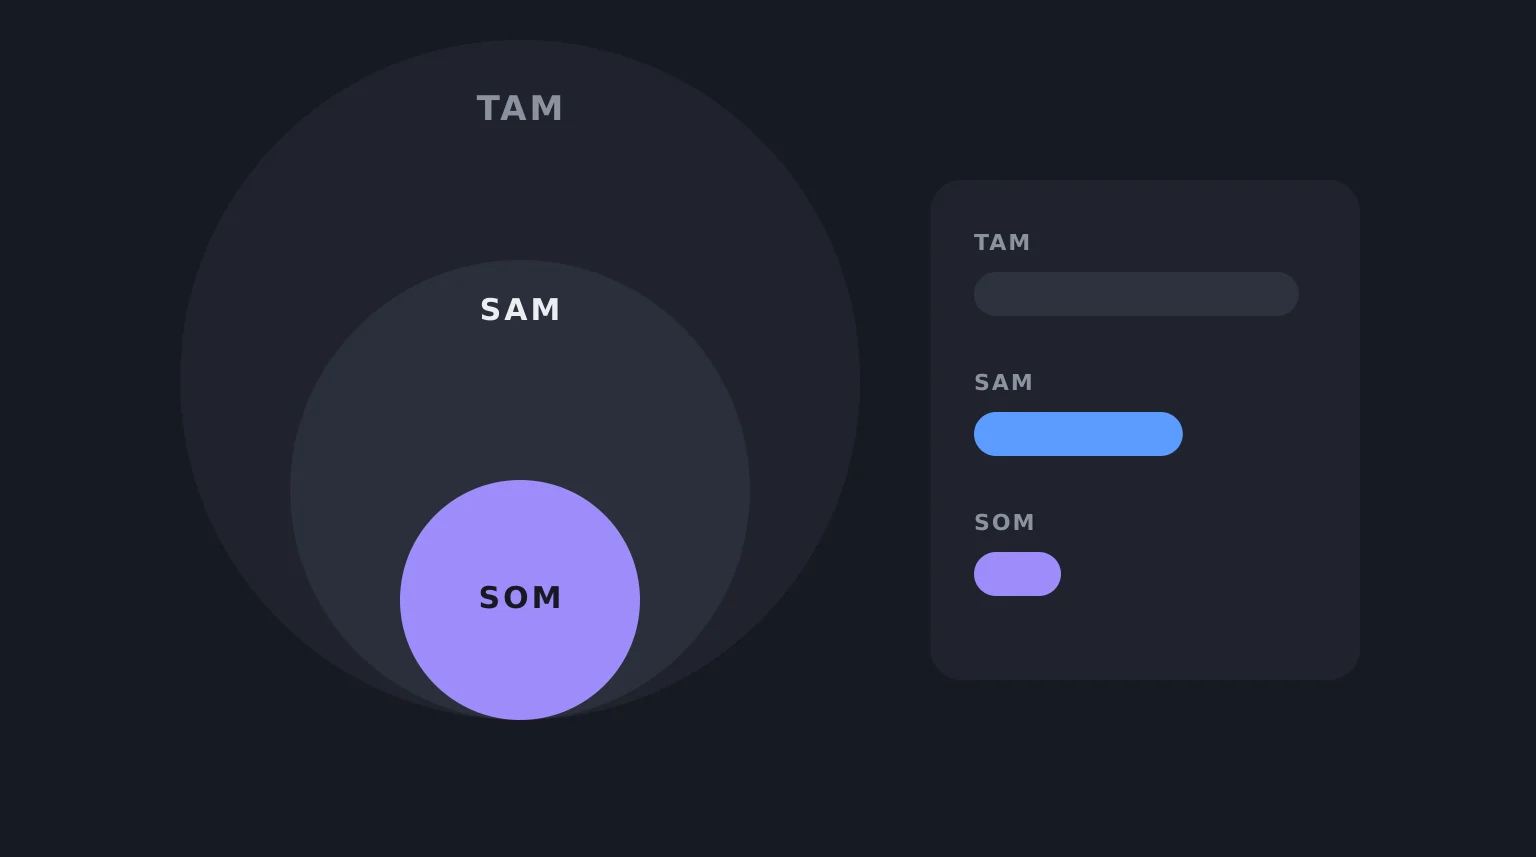
TAM, SAM and SOM are three nested estimates of how much money is in a market. TAM (total addressable market) is the total revenue if everyone who could use your product did. SAM (serviceable addressable market) is the part of that you could actually reach with your product and channels. SOM (serviceable obtainable market) is the share of SAM you can realistically win in the next few years. Each is smaller than the one before.
This guide defines each, shows the two ways to calculate them with a worked example, and covers the mistakes that make most market sizes meaningless. The example uses made-up numbers, labelled as such, so you can see the arithmetic without mistaking it for market data.
What do TAM, SAM and SOM mean?
| Term | Stands for | The question it answers |
|---|---|---|
| TAM | Total addressable market | If every possible customer bought, how much revenue is that? |
| SAM | Serviceable addressable market | How much of that can my product and channels actually serve? |
| SOM | Serviceable obtainable market | How much can I realistically capture in the next one to three years? |
A picture that helps: three concentric circles, TAM the outer one, SAM inside it, SOM inside that. People often quote the outer circle because it is the biggest number. The one you can plan a business around is the inner one.
You can express each as revenue (customers multiplied by price) or as a count of customers or units. Revenue is the usual form for investors. Customer counts are often more useful to a founder, because you can picture 300 customers and you cannot picture $25 million.
How to calculate TAM, SAM and SOM
There are two approaches, and they are best used together.
Top-down starts from a published market figure and narrows it. For example, take an analyst report's total for a category, then apply percentages for geography, segment and so on. It is quick, and its weakness is that the headline figure is usually broad, third-party and hard to check.
Bottom-up starts from your own unit economics and builds up. Count the customers in a segment you can name, multiply by what each would pay, and sum. It takes more work, and it is far more credible, because every number is one you can defend or go and measure.
The formulas are the same in both cases:
- TAM = number of potential customers × annual revenue per customer
- SAM = TAM × the share you can serve with your product, geography and channels
- SOM = SAM × the share you can realistically win
A worked example (illustrative numbers)
Take a scheduling and waitlist tool for independent physiotherapy clinics in the US, priced at $150 a month, or $1,800 a year. The figures below are assumptions for the example, not market research.
TAM. Suppose there are 35,000 independent clinics in the US. If every one bought:
35,000 clinics × $1,800 = $63,000,000 a year
SAM. You are not going to serve every clinic. Say your product suits clinics with two to eight practitioners that already take bookings online, and that is 40% of the total:
35,000 × 40% = 14,000 clinics, and 14,000 × $1,800 = $25,200,000 a year
SOM. Now the honest part. With one founder, no sales team and a few channels, a realistic two-year goal might be 2% of that serviceable group:
14,000 × 2% = 280 clinics, and 280 × $1,800 = $504,000 a year
The three numbers tell different stories. $63 million sounds exciting and says almost nothing about your business. $504,000 a year is a modest, believable outcome that you can check against reality: 280 clinics is about 12 new customers a month for two years. Can you get 12 demos booked and closed every month? That is a question about your channels, and it is the one that matters.
How to find the inputs
The weak point of any market size is its inputs, so spend your effort there.
- Number of customers. Industry association member counts, government business statistics, licensing registers, app-store or directory listings, and counts from a few searches on a platform where your customers cluster.
- Price. What your closest alternatives charge today, including the spreadsheet or the manual process they use now. If you have no price, run a few conversations and ask.
- Serviceable share. The filters that apply to your product: geography, company size, tools they already use, regulation, language.
- Obtainable share. Start from channel capacity, not from a market percentage. How many leads can you generate, and what fraction will convert?
Write down where each input came from. A number with a source can be challenged and improved. A number without one gets repeated until it turns into a fact.
Common mistakes
The "1% of a huge market" argument. "If we capture just 1% of a $10 billion market, that is $100 million." It is the most common line in weak pitches, because it hides the fact that you have no plan for capturing even the first customers. Build SOM from the channels you have.
Confusing TAM with the revenue you can reach. TAM assumes everyone buys and nobody else competes. Quoting it as the opportunity overstates it by an order of magnitude or more.
Mixing units. A TAM in users and a SAM in revenue cannot be compared. Pick one unit and stay in it.
Using one source for a top-down figure. A single report's category definition may not match your product. Cross-check against a bottom-up count.
Ignoring the current alternative. If customers solve the problem with a spreadsheet, your real competitor is free. That caps what they will pay, and it belongs in the price input.
Treating it as a one-time exercise. Revisit the numbers when you learn something. A SOM that you cannot update is a slogan.
TAM, SAM and SOM for a startup or a solo builder
For a funded startup, TAM matters to investors, because it says whether the business could ever be large. They will usually expect both a top-down and a bottom-up view.
For a solo builder or small team, the ranking flips. TAM is nearly useless, and SOM is nearly everything, because it answers the question you are actually asking: can this support me? A SOM of a few hundred thousand dollars a year can be an excellent outcome for one person and a non-starter for a venture-backed company. Decide which you are before you decide which number to lead with.
Market size is only one part of a business case. It tells you the prize, and nothing about whether the problem is real, whether the price works or what could kill the idea. The business case template puts market framing alongside the problem, the monetisation and the kill criteria, and it takes 30 minutes. If you want a first draft to argue with, the free Business Case Generator returns a qualitative TAM, SAM and SOM framing from a one-paragraph idea. It is directional and not backed by live market data, so check the inputs yourself.
FAQ
What does TAM SAM SOM stand for?
TAM is total addressable market, SAM is serviceable addressable market, and SOM is serviceable obtainable market. They are nested: SOM sits inside SAM, which sits inside TAM.
How do you calculate TAM, SAM and SOM?
Multiply the number of potential customers by annual revenue per customer to get TAM. Multiply TAM by the share you can serve to get SAM. Multiply SAM by the share you can realistically win to get SOM. You can start top-down from a published market figure or bottom-up from your own customer counts and pricing, and bottom-up is usually more credible.
What is the difference between TAM, SAM and SOM?
TAM is everyone who could buy. SAM is the part your product and channels can actually serve. SOM is the part you can realistically win in the next few years. The gap between each is where your assumptions about product, reach and competition live.
Is TAM measured in revenue or customers?
Either. Investors usually want revenue, which is customers multiplied by price. Founders often find customer counts easier to reason about. Use one unit consistently across all three numbers.
How big should my TAM be?
Big enough that the business could reach its goal if things go well, but the number to plan with is SOM. A very large TAM does not make a weak plan stronger, and a small one can still support a good business, especially for a solo or small team.
What is a good SOM?
One you can explain through channels: how many leads, how many convert, how many customers that gives you in one to three years. A SOM expressed as a percentage of SAM with no channel behind it is a guess.
Related reading
- Business case template: free one-page version with examples, where market size sits alongside the problem, price and kill criteria.
- What is a PRD?, for turning an idea that passes the business case into requirements.
- Spec-driven development, for the path from a validated idea to something buildable.
Sources and further reading
- Eric Ries, The Lean Startup (Crown Business, 2011): validating demand before sizing it.
- Alexander Osterwalder and Yves Pigneur, Business Model Generation (Wiley, 2010): the canvas that market size feeds into.
- Ash Maurya, Running Lean (O'Reilly, 3rd edition, 2022): customer-first estimation for small teams.